The Analytics section provides you with a comprehensive overview of the performance of your NeetoForm. It displays key metrics such as views, submission count, completion rate, and average time to complete. It shows the percentage distribution of devices, operating systems, and browsers used by participants when submitting the form as well.
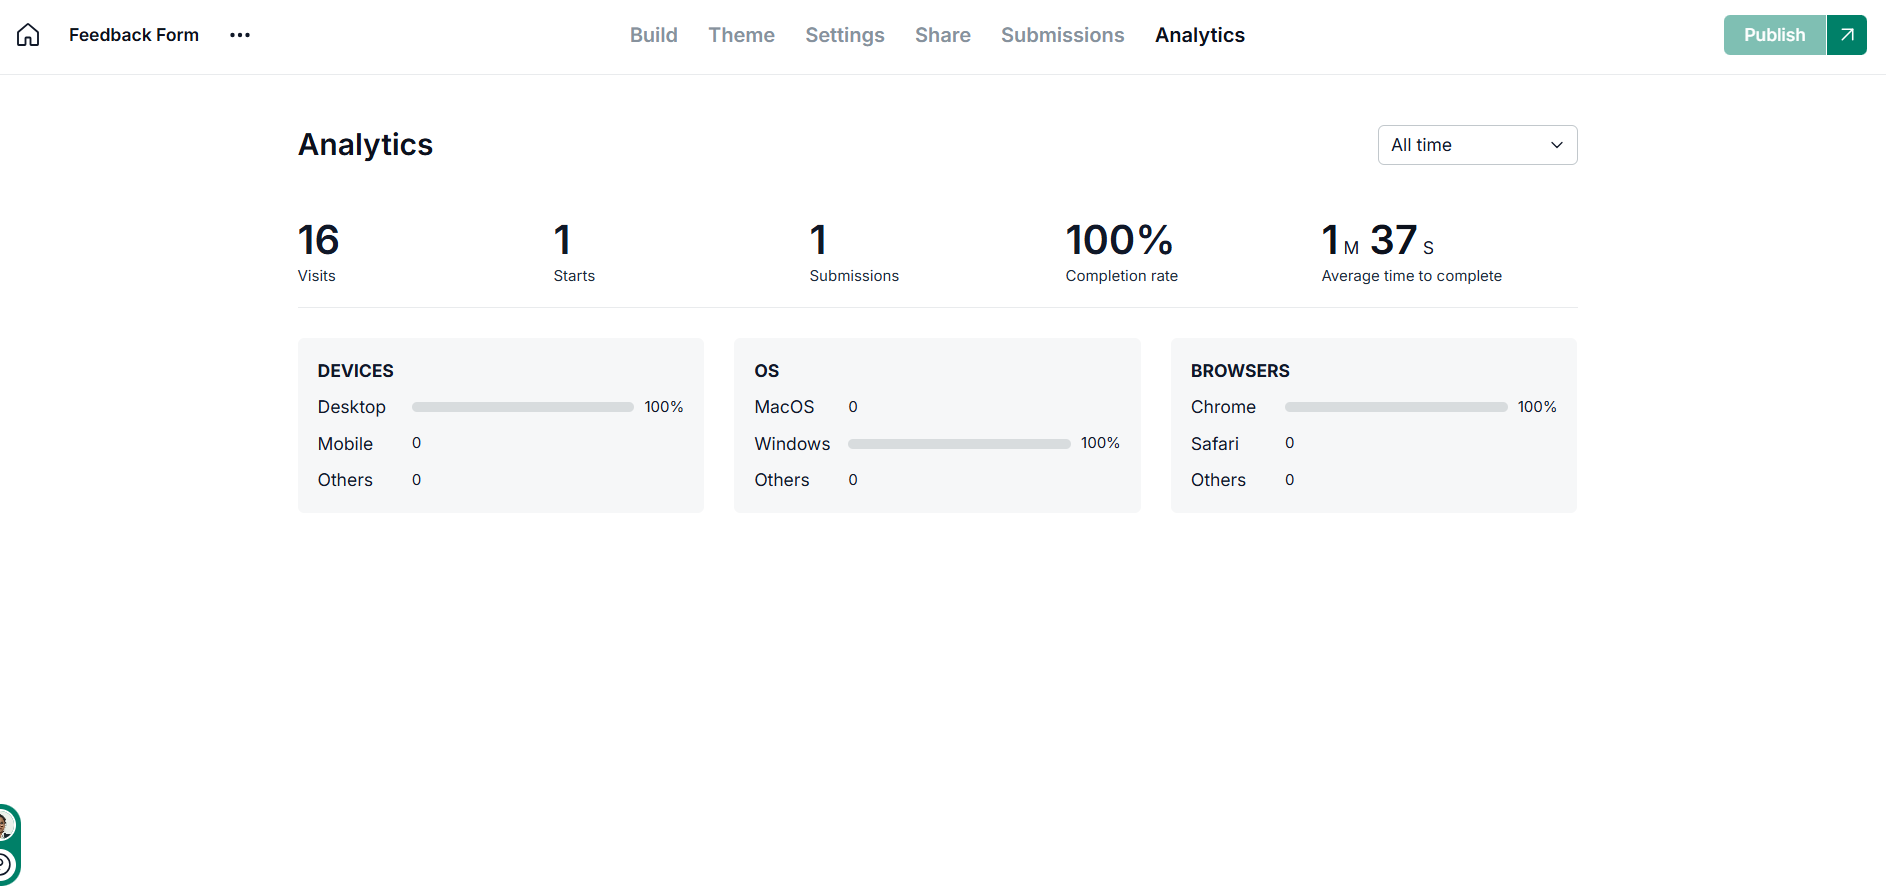
Visits: the total number of times the form was loaded, regardless of whether it was started or not.
Starts: the total number of times participants began filling out the form by answering at least one question, regardless of whether they completed and submitted it.
Submissions: the count of successfully completed and submitted responses.
Completion Rate: the percentage of participants who finished the form after starting it. This is determined by dividing the total number of submissions by the total number of starts, then multiplying by 100.
Time to Complete: the average duration participants took to finish the form, measured from the moment they started until clicking the Submit button.
Note: If you delete a submission from your submissions, it will affect these metrics.
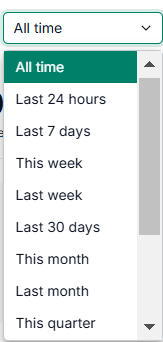
Filters
Date range filters can be applied to insight data. This filter is global and will be applied to all data displayed under insights.